# import matplotlib
:Python 的第三方库,提供了一些模仿 MATLAB 的数学绘图函数,并基于 tkinter、qt5 等 GUI 库显示图像。
- 官方文档 (opens new window)
- 图像示例 (opens new window)
- 安装:
pip install matplotlib
# 折线图
使用绘图函数时,通常输入 numpy.array 等类型的数组,就会在坐标轴中绘制函数曲线。
可以用
plt.plot()绘制一条折线,如下:>>> import matplotlib.pyplot as plt >>> x = [1, 2, 3] >>> y = [-1, -2, -3] >>> plt.plot(x, y) # 绘制一条折线,x、y 数组分别表示各个点的 x 轴、y 轴坐标,两个数组的长度必须相同 [<matplotlib.lines.Line2D object at 0x000001F35773F820>] >>> plt.plot(y, x, label='line2', linestyle='', marker='.') # 绘制第二条折线,它是散点线 [<matplotlib.lines.Line2D object at 0x000001F35801BB20>] >>> plt.show() # 显示 Figure 窗口plt.plot()的常用参数:label='xx' # 折线的名称 linewidth=1.0 # 线宽 linestyle='-' # 线型 marker='' # 节点标记的形状 color='#008000' # 线的颜色。默认每次绘制时,会按蓝、橙、绿等顺序分配颜色- 线型有以下几种:
None '' ' ' '-' '--' '-.' ':' 'solid' # 实线 'dashed' # 虚线 'dotted' # 点线 'dashdot' # 点划线 - 节点标记的形状有以下几种:
's'         # 正方形
'o'         # 圆形
'^'         # 正三角形,分为四种朝向
'>'
'v'
'<'
'd'         # 正菱形
'p'         # 正五边形
'h'         # 正六边形
'8'         # 正八边形
- 线型有以下几种:
# 动态折线图
例:
import random

plt.ion()
last_dot = [0, 0]
for i in range(100):
    new_dot = [i, random.randint(0, 10)]  # 生成当前点的坐标
    # 每次循环会绘制一条新折线,与上一条折线连接,并采用统一的颜色
    plt.plot([last_dot[0], new_dot[0]], [last_dot[1], new_dot[1]], color='blue')
    last_dot = new_dot
    plt.pause(0.1)
# Figure
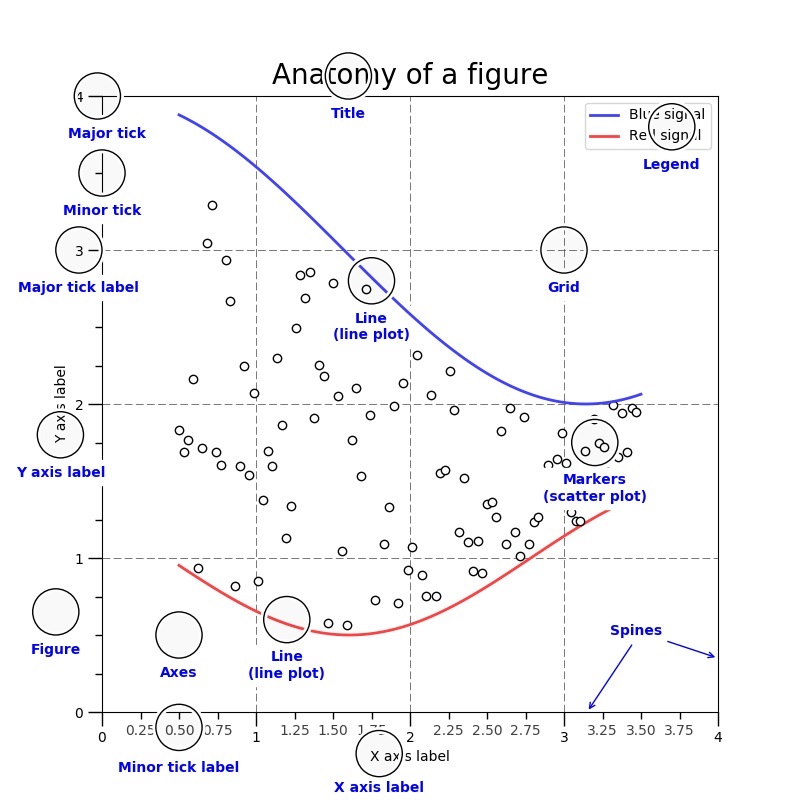
Matplotlib 提供了显示图像的 GUI 窗口,称为 Figure 。其结构如下:

- 每个 Figure 上可以显示一个或多个坐标区(Axes)。
- 坐标区的坐标轴(Axis)有多种类型:
- xy 二维坐标轴
- xyz 三维坐标轴
- 极坐标轴
通常有两种绘图方式:
- 通过
plt.plot()直接绘图,只能操作一个 Figure 实例。 - 通过
plt.figure()创建 Figure 实例,以面向对象的方式绘图。
- 通过
# 交互模式
显示 Figure 窗口时默认采用非交互模式:
- 执行
plt.plot()等函数时只会记录图像数据,不会实际绘制。执行plt.show()才会开始绘制图像,显示 Figure 。 - Figure 显示期间会一直阻塞前端,直到用户关闭其窗口。
- 执行
在交互模式下:
- 执行
plt.plot()、plt.show()等函数都会立即显示 Figure 窗口,如果已显示则更新显示。 - Figure 显示期间不会阻塞前端,从而可以继续执行其它代码来修改 Figure 。
>>> plt.ion()                     # 打开交互模式
>>> matplotlib.is_interactive()   # 判断是否处于交互模式
True
>>> plt.ioff()                    # 关闭交互模式
- 执行
执行
plt.pause(n)会显示 Figure ,并阻塞前端 n 秒。
# 关闭窗口
- 显示 Figure 窗口时,如果用户关闭该窗口:
- 非交互模式下,会自动销毁该 Figure 对象,导致不能再次显示。
- 交互模式下,可以再次显示。
- 可以在代码中主动关闭 Figure 窗口:
>>> plt.close()           # 关闭当前的 Figure
>>> plt.close(f1)         # 关闭指定的 Figure
>>> plt.close('test1')    # 关闭指定名称的 Figure(该名称不存在时并不会报错)
>>> plt.close('all')      # 关闭所有 Figure
# 排版
plt.axis('off')             # 不显示坐标轴(默认显示)
plt.axis([0, 10, 0, 1])     # 设置 x 轴和 y 轴的长度(如果设置了,显示时窗口比例会固定,否则会自动调整)

plt.title('Simple Plot')    # 设置图像的名称(默认为空),这并不是设置 Figure 窗口的 Title
plt.xlabel('x label')       # 设置 X 轴的名称(默认为空)
plt.ylabel('y label', fontsize=16))
plt.legend()                # 显示图例(这会自动提取每条折线的 label 名作为图例名)
plt.grid(True)              # 在坐标轴区域显示网格线

plt.cla()                   # 对当前 figure 中的所有坐标轴执行 axes.cla(),清除其显示内容
plt.clf()                   # 清除显示当前 figure 中的所有坐标轴

plt.savefig('./1.png')      # 保存图像
# 后端
- Matplotlib 将执行代码的线程称为前端,将显示 Figure 的线程称为后端。
- 管理 Matplotlib 后端的 GUI 引擎:
>>> matplotlib.get_backend()    # 查看当前引擎
'TkAgg'
>>> matplotlib.use('qt5agg')    # 使用指定的引擎
ImportError: Failed to import any qt binding
# 实例化
创建 Figure 实例:
>>> f1 = plt.figure()           # 创建一个 Figure
>>> f2 = plt.figure('test')
>>> f3 = plt.figure('test')
>>> f1.show()                   # 显示 Figure
>>> plt.show()                  # 显示所有已激活的 Figure
相关 API :
def figure(num=None,        # 设置 ID
           figsize=None,    # 设置宽度、高度,比如 (3, 2.2)
           dpi=None,        # 设置分辨率,比如 10 。实际的显示尺寸等于 figsize*dpi
           facecolor=None,  # 设置背景色
           edgecolor=None,  # 设置边框颜色
           clear=False,     # 如果已存在相同 ID 的 Figure 则清除它
           **kwargs
           )
创建 Figure 时,传入的 num 参数会用作其唯一 ID 。
- 如果没传入 num 参数,或者传入的 num 参数不是 int 类型,则会自动使用一个从 1 开始递增的 num 值。如下:
>>> f1.number 1 - 如果传入的 num 参数是 str 类型,则会用作该 Figure 的 Title 。如下:
>>> f2.number 2 >>> f2.get_label() 'test' - 如果传入的 num 参数是 int 型,且已存在相同 ID 的 Figure ,则会激活该 Figure 并返回其引用。否则创建一个新的 Figure 并返回其引用。如下:
>>> f1 == f2
False
>>> f2 == f3
True
- 如果没传入 num 参数,或者传入的 num 参数不是 int 类型,则会自动使用一个从 1 开始递增的 num 值。如下:
# Subplot
创建一个 Figure 时,默认只包含一个坐标轴图像,可以划分多个子图(Subplot):
>>> fig, axes = plt.subplots(1)       # 创建一个 Figure ,采用 1 行的网格布局,每一格包含一个子图
>>> fig, axes = plt.subplots(2, 3)    # 创建一个 Figure ,采用 2 行、3 列的网格布局,每一格包含一个子图
>>> fig
<Figure size 640x480 with 4 Axes>
>>> axes                              # axes 数组中,每个元素对应一个子图的 axes
array([[<AxesSubplot:>, <AxesSubplot:>],
      [<AxesSubplot:>, <AxesSubplot:>]], dtype=object)
>>> ax1 = axes[0, 0]                  # 选中第一个子图的 axes
>>> ax1.plot(x, x)
[<matplotlib.lines.Line2D object at 0x000001F35B72B1F0>]
>>> plt.show()
可以给已有的 Figure 添加子图:
>>> f1 = plt.figure() >>> f1.add_subplot(2, 3, 1) # 让 Figure 采用 2 行、3 列的网格布局,将子图放在横向第 1 格内(只能位于第 1 行内) <AxesSubplot:> >>> f1.add_subplot(3, 3, (1,2)) # 让 Figure 采用 2 行、3 列的网格布局,将子图放在横向第 1 格至 第 2 格区域(只能位于第 1 行内) <AxesSubplot:> >>> f1.add_subplot(331) # 当网格布局的行列数不超过 9 时,可以将前三个参数合并成一个三位整数 <AxesSubplot:>- 相关 API :
def add_subplot(nrows=1, ncols=1, index=1, **kwargs)- index 的取值必须符合
1 ≤ index ≤ nrows,否则会报错。 - 可以给同一个 Figure 多次添加子图,不过新的子图在显示时会覆盖旧的子图。
- index 的取值必须符合
- 相关 API :
# 显示图片
例:
>>> from matplotlib import pyplot as plt, image
>>> img = image.imread('./1.jpg')   # 读取本地图片
>>> p1 = plt.imshow(img)            # 将图片导入 Figure
>>> plt.show()                      # 显示 Figure
读取到的图片对象实际上存储在 numpy 数组中:
>>> type(img)
<class 'numpy.ndarray'>
>>> img
array([[[ 72, 164, 201],
        [ 64, 156, 193],
        [ 66, 158, 195],
        ...,
        [  0,  54,  74],
        [  0,  53,  73],
        [  0,  54,  74]]], dtype=uint8)